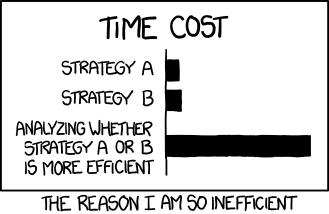
Link:https://xkcd.com/1445/
Micro-optimizations — Heroin for programmers. It’s easy to tell who’s been doing it, they always have a few small tricks up their sleeves, and they try to force it down everyone’s throats — concatenation strings, fast ways to compare if string is empty, and so on. I once had a friend bark at me for writing “string” + “c”, saying I should have used a character ‘c’, apparently, it was “faster”. A few loops unrolled here, a few variables reused here, yeah, I’m optimizing! I’m a rockstar!
Just like how heroin gets abused, a lot of programmers suffer from what I call Premature Optimization Syndrome. Premature Optimizations means trying to optimize code without knowing if
- Their code actually needs tuning, or
- Their techniques actually work.
Premature, unproven optimizations are bad, as the infamous Donald Knuth once said:
Programmers waste enormous amounts of time thinking about, or worrying about, the speed of noncritical parts of their programs, and these attempts at efficiency actually have a strong negative impact when debugging and maintenance are considered. We should forget about small efficiencies, say about 97% of the time: premature optimization is the root of all evil. Yet we should not pass up our opportunities in that critical 3%.
As programmers, we’re really bad at figuring out where the code is slow. If code flows in our blood like coffee, we wouldn’t have Windows Update shouting at us every patch Tuesday. If you are thinking to yourself, I know what my code is doing, I’m a good programmer. Why am I reading this scrub’s post? Give this problem a go:
Note. This blog post is NOT, and I mean NOT, an endorsement of bad coding practices, if you are still calculating Fibonacci series with recursion or BOGOsorting for unexplained reasons, you better get that shit fixed. Good code have performance baked in during design, bad code thinks all optimizations can be done in the last few weeks before shipping.
I needed to find the maximum and the minimum number in an array, unfortunately, I was working in C, and I had to roll my own max and min functions, nothing difficult really.
typedef struct {
	int min;
	int max;
} TwinTuple;

TwinTuple naive() {
	TwinTuple results;
	results.min = results.max = shared_array[0];

	for (int i = 1; i < 10000; i++) {
		if (shared_array[i] > results.max) {
			results.max = shared_array[i];
		}

		if (shared_array[i] < results.min) {
			results.min = shared_array[i];
		}
	}
	return results;
}
I had an epiphany there, if a value is a maximum value, it can’t be a min value! Therefore, if I use an if…else rather than an if, I don’t have to check if the value is a minimum when it is a maximum, this saves us a bit of execution time. Premature optimizations here I come! Should result in faster code…right?
TwinTuple attempt() {
	TwinTuple results;
	results.min = results.max = shared_array[0];

	for (int i = 1; i < 10000; i++) {
		if (shared_array[i] > results.max) {
			results.max = shared_array[i];
		} else if (shared_array[i] < results.min) { //<-- "OPTIMIZATION" HERE
			results.min = shared_array[i];
		}
	}
	return results;
}
STOP HERE
Which one do you think is faster? Will our optimization work?
Since this is a blog, not a Dragon Ball episode, Here are the results now:
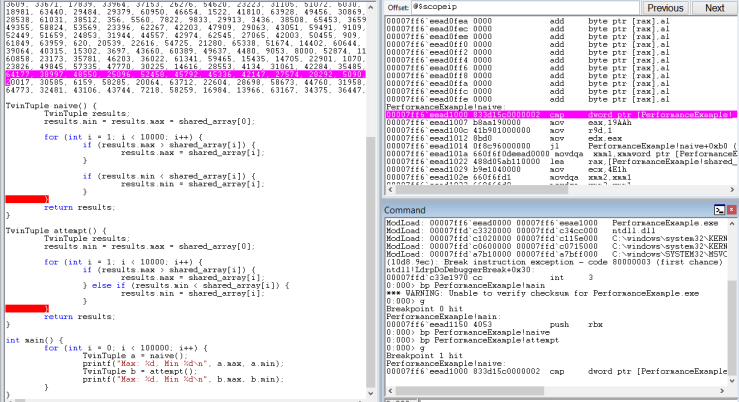
I made a testing bed, using an array of 10,000 values repeated 100,000 times, I put the two functions under a profiler. The results were pretty shocking:

My optimization attempt took almost 10% of the program run time while my naive function only took 2%? The “optimized” function was five times slower, what the hell? How can a function that we have proven to do LESS work, be slower??
I was thoroughly intrigued by this, and somewhat pissed off, so much for outsmarting the compiler! When one layer of abstraction doesn’t solve your problems, you need to go lower.
To debug this problem, we need the right tools, I’ve used WinDBG here as my debugger and disassembler. The disassembly code is what your C code compiles into and what the processor actually runs, so let’s start there.

Don’t worry if you can’t understand most of it, I’ll give a full explanation as we go.
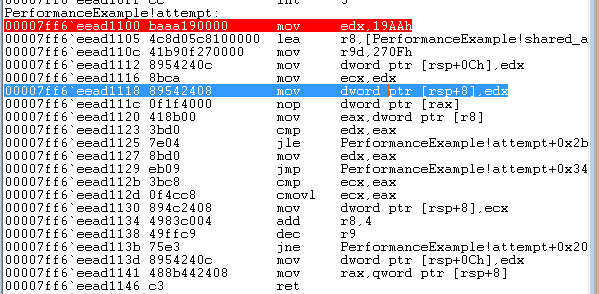
After putting a breakpoint on both naive() and attempt(), we get this in our disassembly window, let’s have a look at our optimization attempt first:

Now I understand most people wouldn’t have a clue on what’s happening. I’ll quickly explain, it loads the values from our shared_array, one at a time, from memory, into a CPU register, EAX. Registers are like variables the CPU actually works with. The assembly instructions tell the CPU to do a CMP between EAX and EDX, which compares the current largest value with the value read from the array. After examining every value in the array, one at a time, it moves the results and returns from it. Simple stuff.
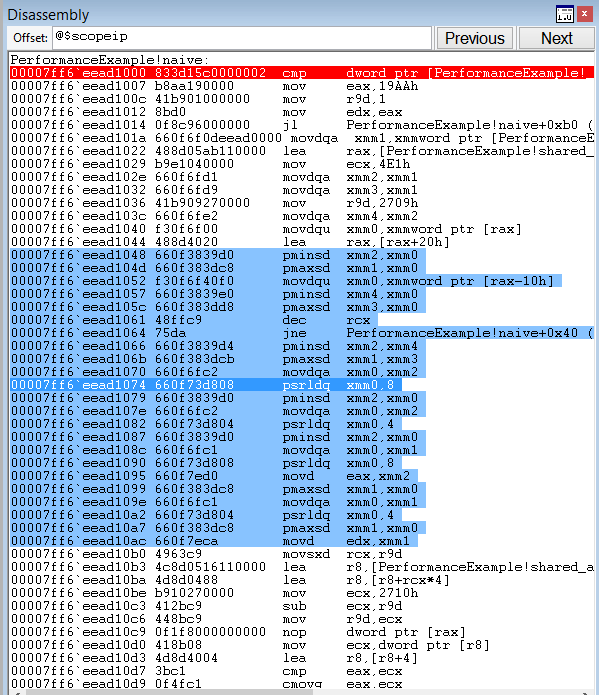
Now let’s have a look at our naive function.

Scanning through the Intel Instruction set reference, the answer becomes clear: the naive function uses PMAXSD and PMINSD, which are SIMD instructions. Without diving too deep, Single Instruction Multiple Data(SIMD) instructions are instructions on a CPU that does calculations on multiple values in one go, rather than one at a time with most normal instructions. In the case of PMAXSD and PMINSD, it will do 4 max/min comparisons with 1 instruction. Compared to, say CMP, which compares one pair of values at a time, this kind of explains our speedup of 5 times, since we’re doing 4 comparisons at a time, rather than 1 at a time, we’ve gotten a speedup of around 4 times. We’re using special instructions of the CPU that makes our code fast, SUCCESS!
Was that what you guessed originally? It certainly wasn’t what I guessed. Are you now convinced that, as programmers, we’re very bad at guessing the performance of our code?
Zealous, nitpicky optimizations must be stopped! As compilers get better and processor infrastructures get more and more complex, it is harder and harder to beat the compiler. But if you need to optimize, here’s some tips:
- PUT YOUR CODE UNDER A PROFILER
Every mature language has a good profiler, this is the holy grail of performance. USE IT. Unless you are programming in some obscure functional flavor of Javascript, YOUR LANGUAGE HAS A PROFILER. Use it to know where to tune. Use it to show you have a speedup, rather than shooting yourself in the foot as I’ve done. - Understand your code
What is your code doing? Quoting Scott Hanselman: What are the tools your tools are built upon? Why does it run slow? What have you done to create a bottleneck? Don’t wave chainsaws in the dark, slashing at every piece of code you see, you may cut off a limb.
